Visualizations
The DSEO consists of six dimensions with hierarchical terms. Each dimension serves to answer a specific question about a data science learning resource.
In the original design of the DSEO, every term was an instance of a SKOS Concept, and all concept instances were connected with the skos:broaderTransitive property. However, for the purposes of browsing on BioPortal, we created a version of DSEO that has a class/subclass structure. This is seen in the Turtle file found on Github and BioPortal.
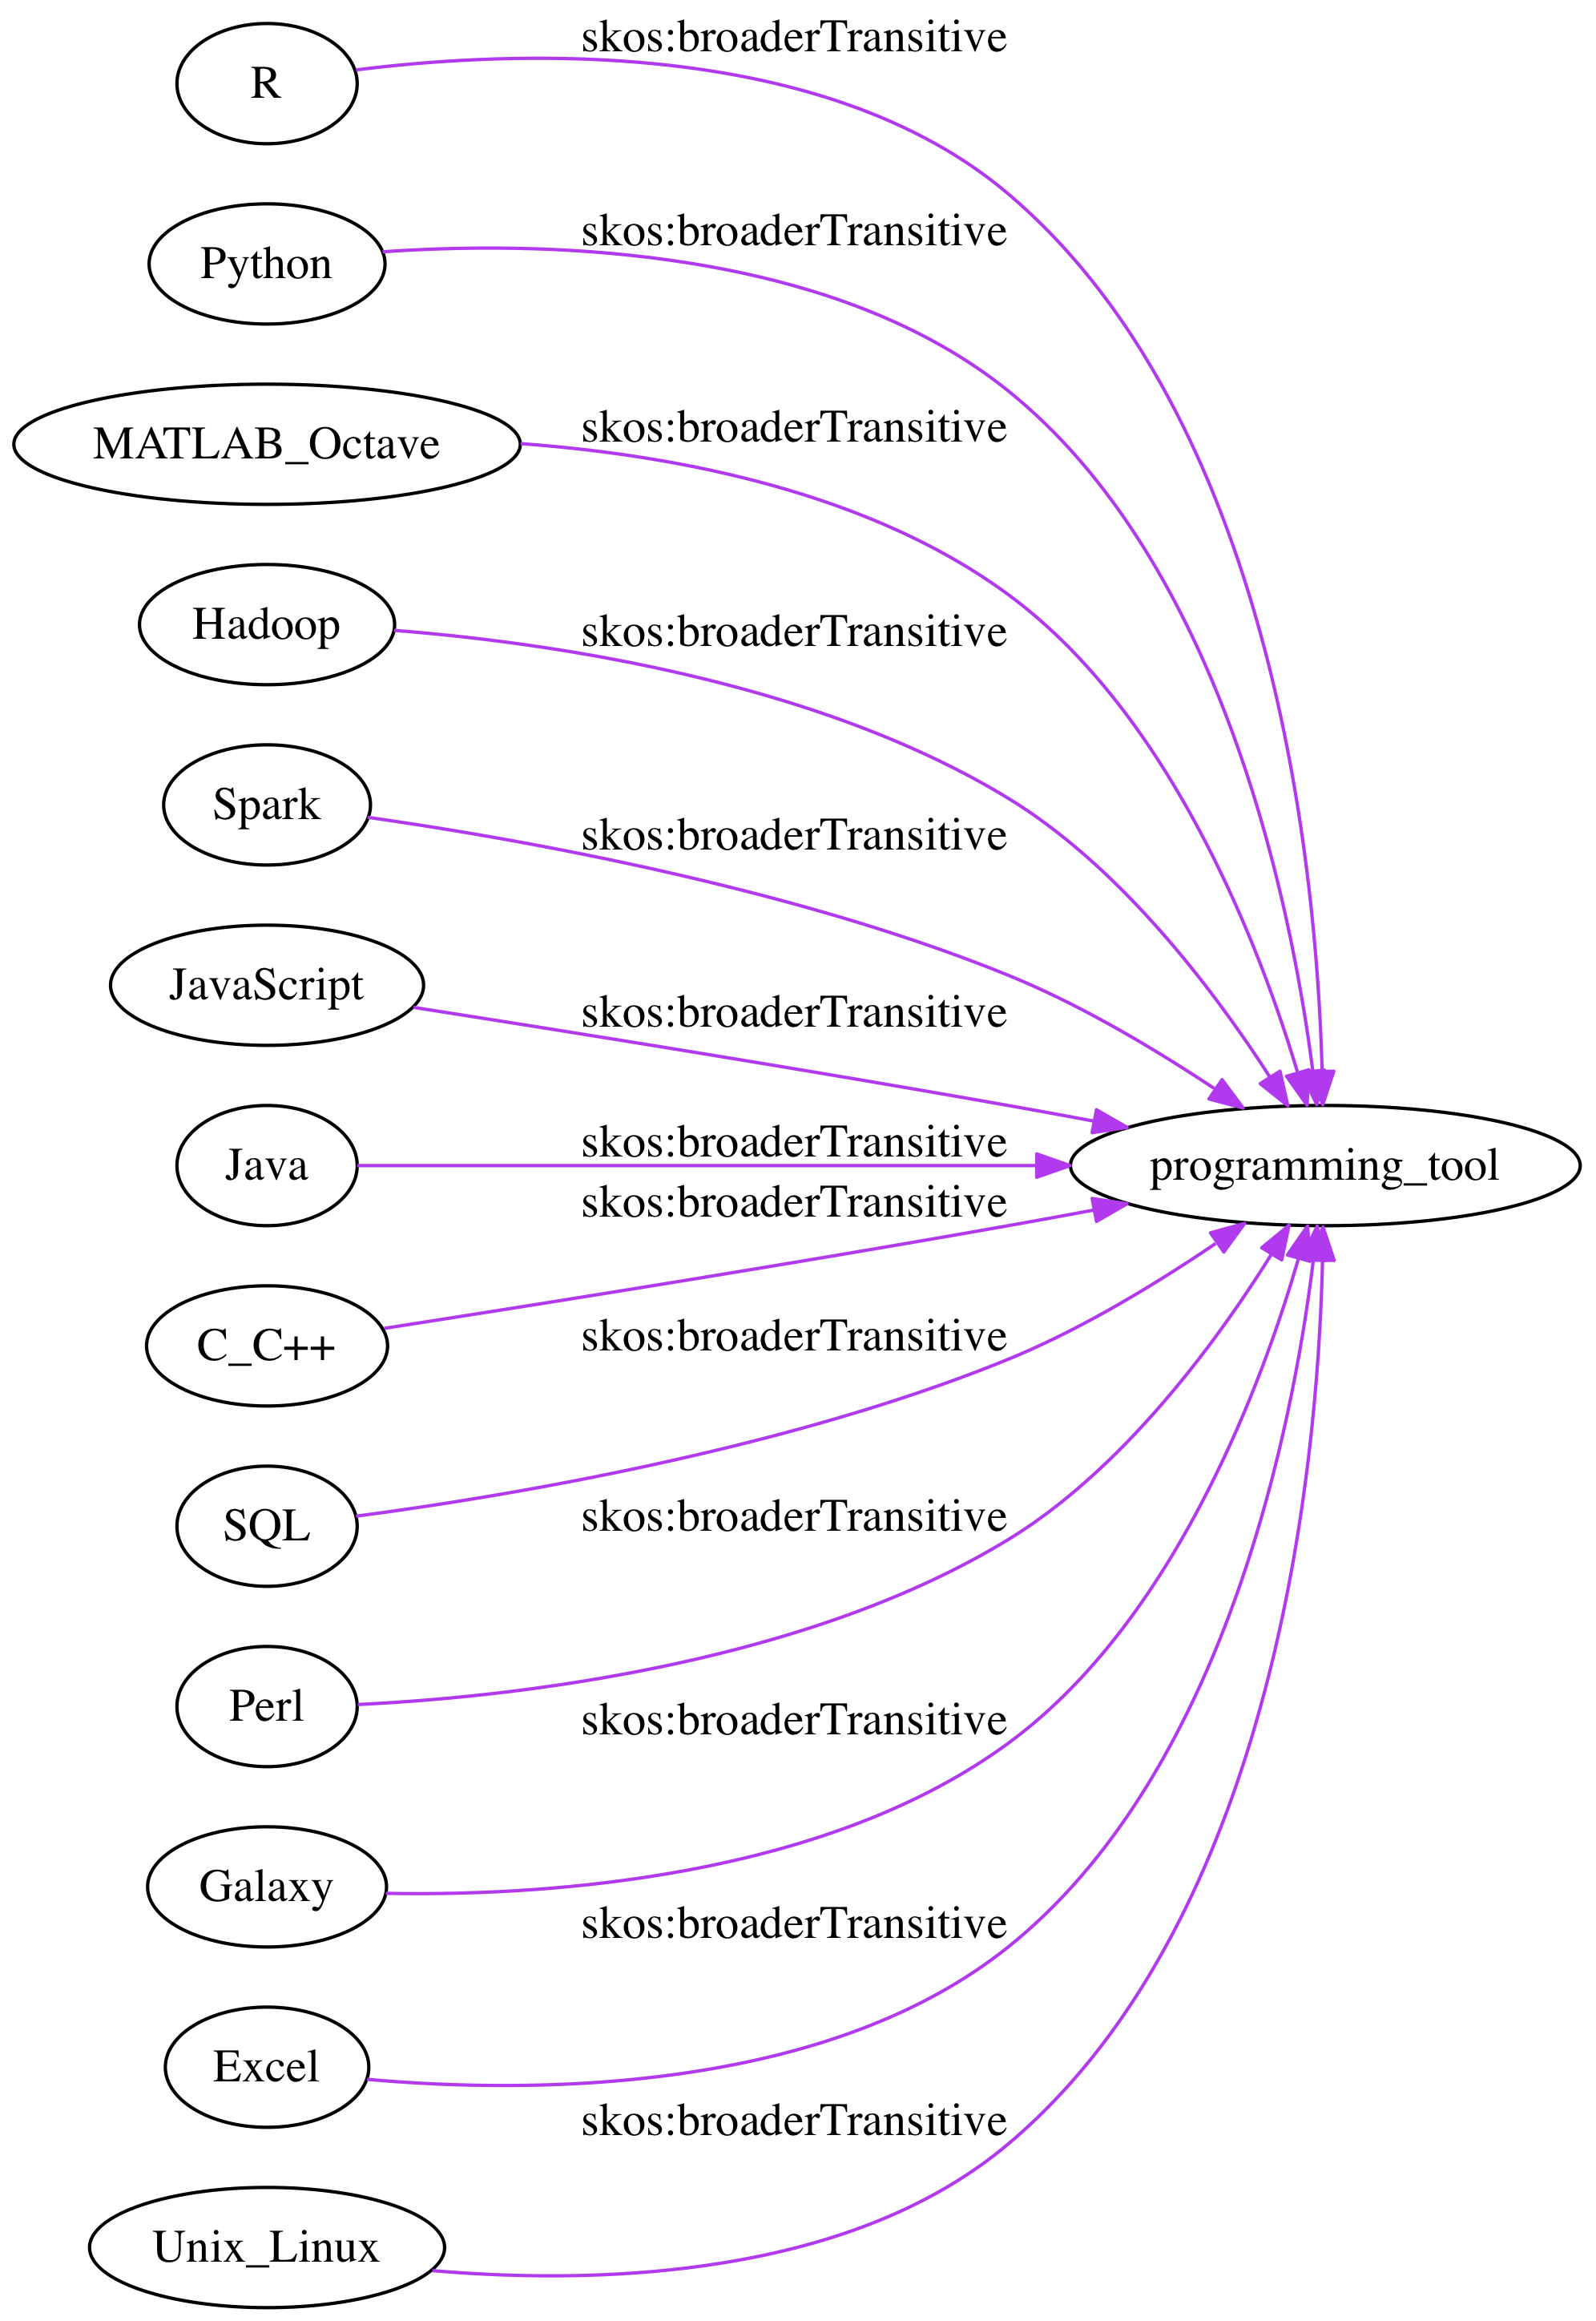
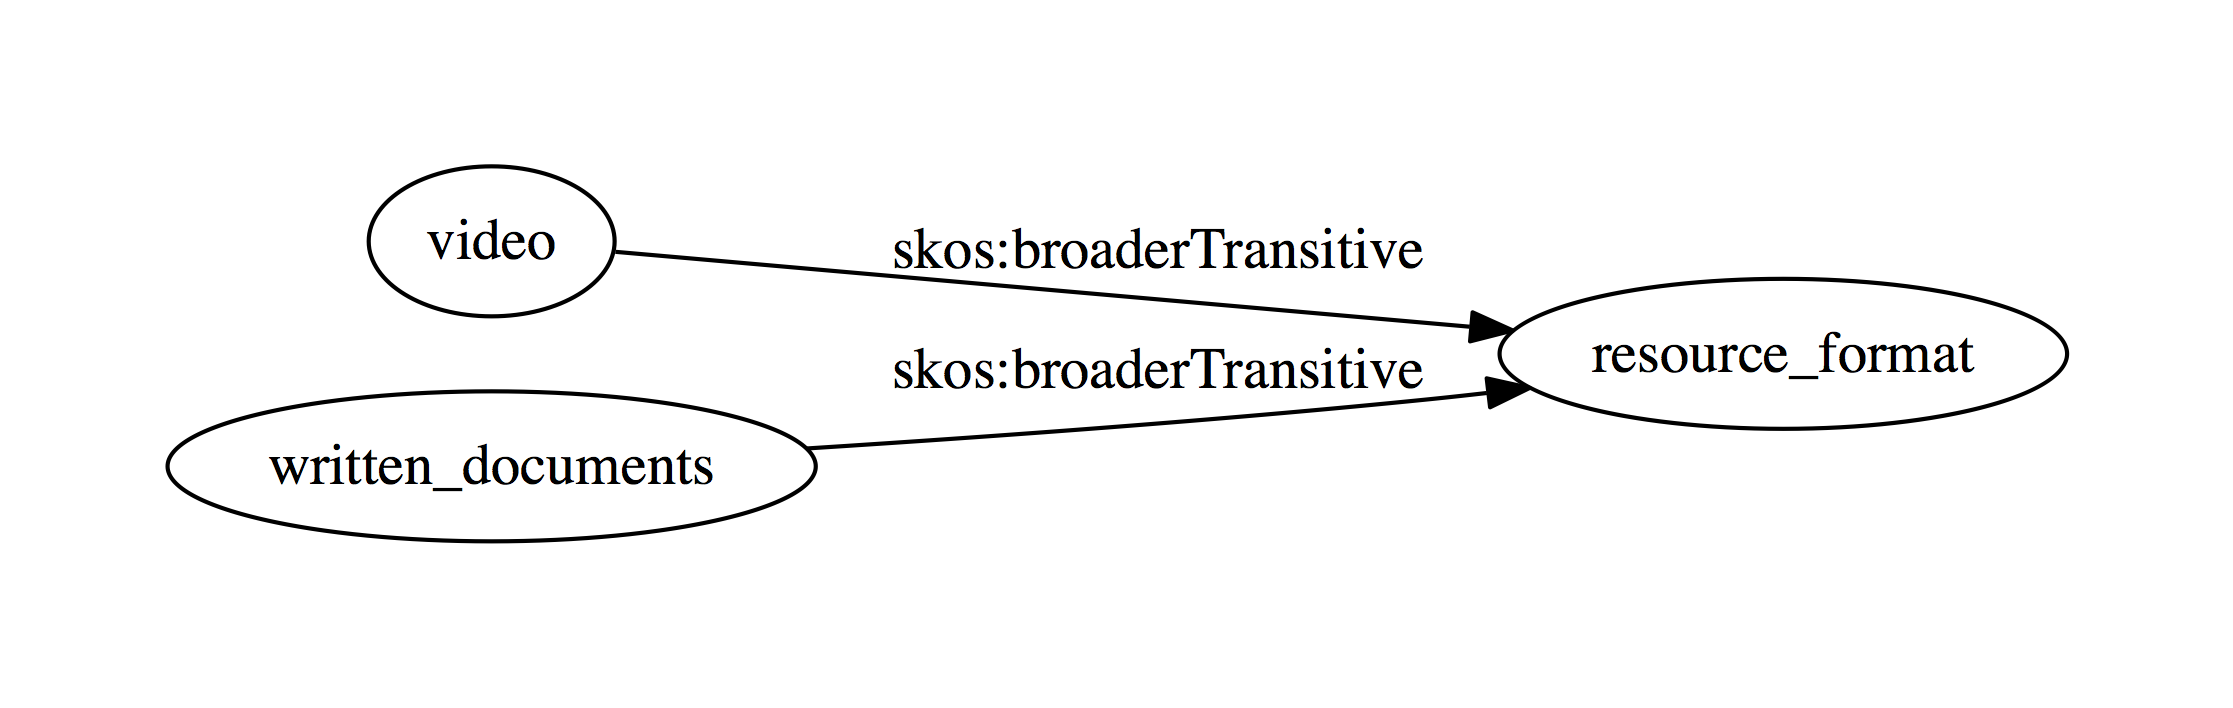
In the visualizations below, each oval is a concept, and each edge is labeled with the original SKOS property. Regarding the color of the edges, magenta edges indicate that the broader node/concept can be used to tag resources, and black edges indicate that the broader node/concept should not be used to tag resources. This color coding thus exists to show which dimension names can and cannot be used as a tag.
Data Science Process (7 concepts)
What stages of the data science process will this resource help me with?
Domain (83 concepts)
What field of study does this resource focus on?
Datatype (18 concepts)
What types of data are addressed in the resource?
Programming Tool (14 concepts)
What programming tool is used in or taught by this resource?
Resource Format (2 concepts)
How is this resource presented?
Resource Depth (2 concept)
How advanced is this resource?